Experience the power of Luzmo. Talk to our product experts for a guided demo or get your hands dirty with a free 10-day trial.


December 7, 2022
Mieke Houbrechts
Is your data model a monster of Frankenstein? Here's why your SaaS platform needs a simple, dimensional data model for embedded analytics.
The simplicity and speed of your client-facing reports highly depend on the data model you use. For a good user experience, these factors are equally, if not more important than the visualizations and UI.
In this article, you’ll learn why your data infrastructure matters. Want to save yourself the headache of an inefficient data modeling and visualization process? Then this is a must-read before you make any decisions on design, technology and tools.
Like any company, your SaaS business has its own day-to-day operational processes.
For example, an e-commerce store has daily transactions like
Most likely, you’re storing these transactions in an operational database in a third normal form (3NF) or entity-relationship (ER) model. These ‘normalized’ models are immensely useful for operational processing. They record and store data for each transaction consistently, and reflect the most current state of your business.
In short, such ‘transactional’ databases deal with one transaction record at a time.

For example, that same e-commerce store can quickly retrieve information like
Now, what if they want to answer more complex questions?
This type of insight will help your customers steer their business effectively. But firing a complex query like that on an operational database will lead to problems.
Here’s why.
If a marketer for this e-commerce store wants to create customer segments, there are multiple ways they could do that.
In a normalized data model, all that information is spread across individual tables to ensure consistent definitions. And that brings along some difficulties:

Often, companies start running BI on top of their operational database because they already have one in place. Even though it seems a logical starting point, there are many pitfalls.
In the best-case scenario, you have small amounts of data and a fairly simple data model. But at one point, you’ll run into issues due to growing data amounts or models. You risk negative customer feedback and a bad customer experience, without immediate solutions at your service. A poor experience is not only detrimental to your company’s reputation, but also a cause for churn.
In the worst-case scenario, you also risk impacting your core platform and day-to-day operations. Your queries run on the same infrastructure that holds up your entire operational processes. It could cause a major platform disruption, costing your company millions.
Most of these companies end up having to start all over, rebuilding their data model and visualizations from scratch. By building an optimized data model before reporting on your data, you’ll avoid wasting precious engineering resources and risking reputational damage.
Business users or SaaS product users will use business intelligence reports or dashboards. They want to make fast, complex decisions based on a combination of relevant data. To make those reports valuable and successful, keep in mind the following prerequisites when designing a data structure for that purpose.
Navigating data should be obvious and intuitive for a business user. Therefore, your data structure should mimic your product user’s processes. The more closely your data structure resembles the existing flow of work, the faster you’ll return query results.
Garbage in = garbage out. Before you expose insights to customers, your should carefully assemble, cleanse and assure the quality of your data. Use common labels and definitions across all your data sources that reflect your customer’s vocabulary.
User needs and business conditions can change in an instant. So do data and technology. Design a system that can handle change. Your existing data shouldn’t be disrupted every time you add new data or requirements.
Business users need to make complex decisions in mere minutes. To serve these needs, you need to convert raw data into actionable insights within a few seconds. Again, query speed is of the essence.
As opposed to a data infrastructure built around ‘transactions’, client-facing dashboards require a different data structure.
A dimensional data model is widely accepted as the preferred technique for presenting this type of analytical data. There are many benefits of dimensional modeling:
Dimensional Data Modeling is a technique to make data easy to use, as well as optimize the performance of data retrieval. Many companies use an ETL process (Extract, Transform and Load) to transform their normalized data into a dimensional model. Then, they store it in a Data Warehouse for further analysis.
Based on the example below, we will guide you briefly through the 5 components of a good dimensional data model.
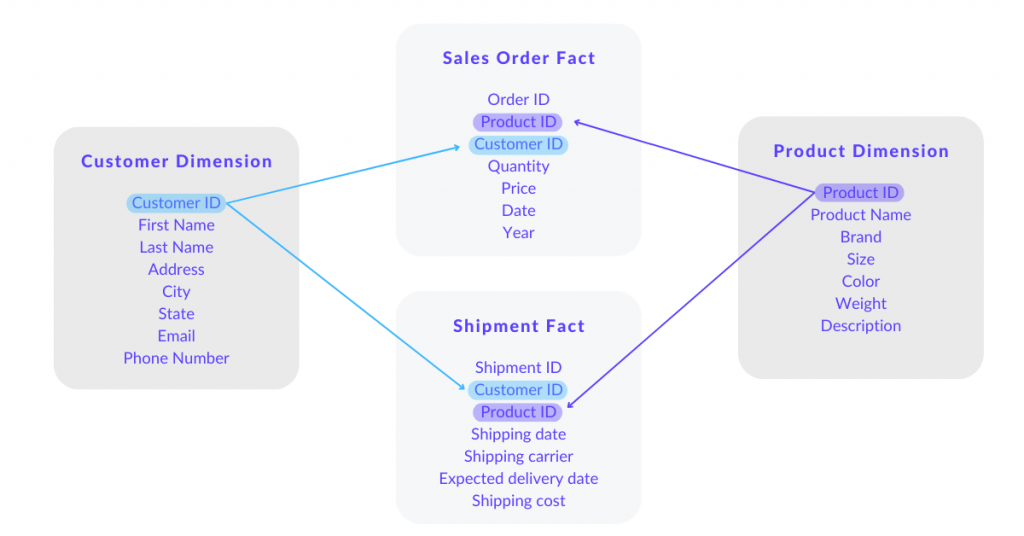
The range of information that contains data around one or more business measurements, like Customer or Product in our example. Dimensions give the context to Facts.
Facts are a collection of measurements, metrics and transactions from different business processes, linked with associated dimensions via a key or ID.
An example: Quantity, price, date and year is a collection of metrics. They form the Sales Order fact, linked with Customer id to the Customer dimension.
Attributes are the elements that characterize a dimension. They essentially make up the Dimension Table, which we’ll discuss below.
An example: Let’s take the dimension ‘Customer’. Attributes of the dimension ‘Customer’ are
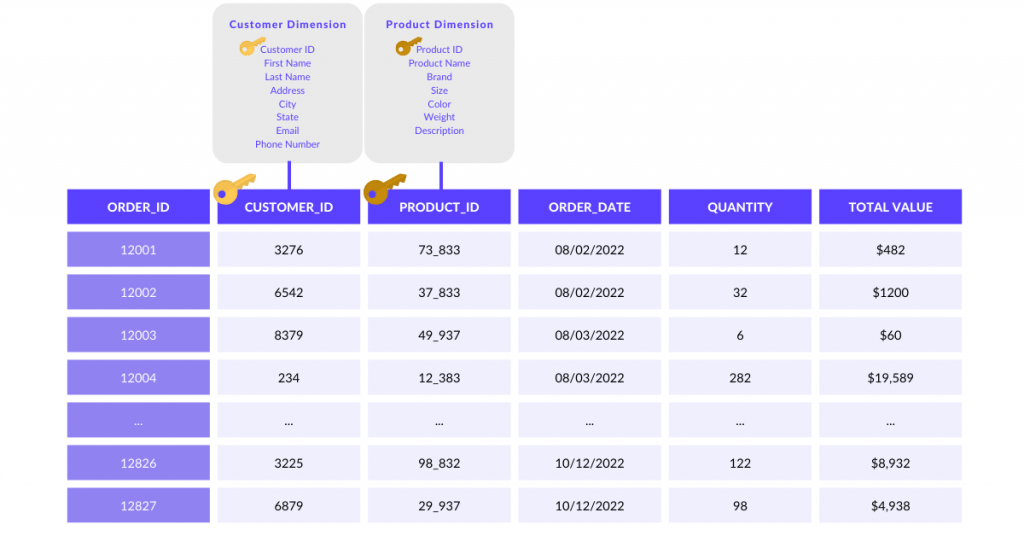
Fact tables store measures or transactions of a business. As a rule of thumb, they have a huge amount of rows, but fewer columns. Fact Tables are related to Dimension Tables (discussed further down) with the keys known as ‘foreign keys’.
An example: for an e-commerce business, each order will be stored as a row in the “Orders” Fact table. It can contain columns such as customer_id, product_id, order_date, quantity of items requested, total order value, etc. This table supports insights such as the average amount of items sold per customer in a specific month.
In this example, the customer_id and product_id are the ‘foreign keys’ that link each order to the Customer and Product dimensions respectively.
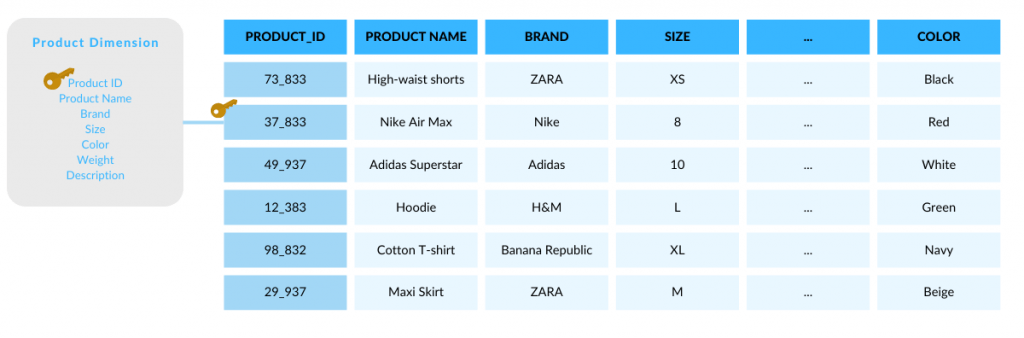
Dimension tables store dimension-specific business information and establish the context for the Facts. Each row contains a ‘primary key’ which can be related to the foreign keys in the Fact table. These rows contain descriptive information about the fact table rows. Dimension tables are usually optimized for lookups: they contain many columns, but fewer rows.
An example
Once you’ve identified all these components for your business, you can effectively build a table structure — or schema — that links the dimensions with the facts.
There are a variety of dimensional data models available. Each model has its advantages and disadvantages depending on the use cases.
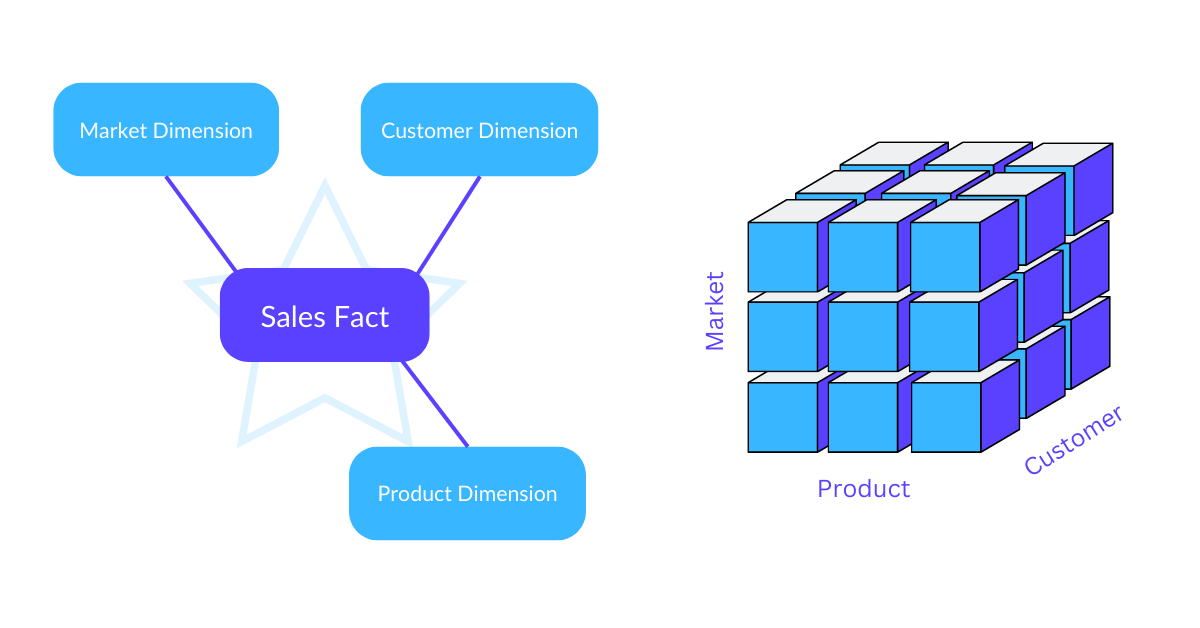
The simplest structure is the star schema. You store transactional or measured data in a single large fact table. Then, you’ll add one or more smaller dimensional tables that store attributes about that data. You’ll often find multiple star schemas, each covering separate topics that you’d like to report on (e.g. orders, shipments, etc.).
Performance is great for basic querying— unless your dimension tables are “large”. In that case, you would require joining large amounts of data. These costly operations will impact the performance. In addition, star schemas require less storage, because your tables only contain unique records.
The model is, however, less intuitive to use for business users as the relations between tables are not designed around business topics. This model is less capable in handling complex and diverse queries, or many-to-many relationships.
OLAP cubes (Online Analytical Processing) are based on similar dimensional data model techniques, but work with denormalized tables per topic.
Therefore, they come with a few additional advantages compared to a simple star or snowflake schema:
OLAP cubes can be built on top of star schemas in e.g. views. This setup only stores unique records in a star schema, and only exposes the denormalized views to business users. Therefore, consuming data becomes much easier.
Building beautiful charts and graphs is a fun and engaging process when turning raw data into insight. It’s tempting to skip ahead to dashboarding immediately. But with a good data model, you’ll save yourself a lot of headaches during the visualization process. And you’ll avoid countless frustrated users who aren’t able to make sense of your data.
When it comes to building a good data model, there is no one-fits-all. Every company has different needs and, therefore, different models. The best data models mimic actual business processes at best. Above, we’ve provided a few modeling techniques you can explore to build your own dimensional data model.
If you’re unsure whether your data model is fit for customer-facing dashboards, book a free consultation with one of our data stack experts.
Experience the power of Luzmo. Talk to our product experts for a guided demo or get your hands dirty with a free 10-day trial.


