Experience the power of Luzmo. Talk to our product experts for a guided demo or get your hands dirty with a free 10-day trial.


March 4, 2021
Mieke Houbrechts
You need a new dashboard software now that Chartio is deprecating? Discover how to migrate from Chartio to Luzmo with ease.
Last week, Chartio announced they will be joining Atlassian. We wish them a big congrats on this awesome news! Unfortunately, this also means thousands of clients are now left without a BI tool in their data stack.
If you’re a Chartio customer, we’re sure you were shocked to hear their data visualization platform will be deprecated as of March 2022. And you’re probably asking yourself: what are we going to do now?
But hey, no need to worry! You still have 12 months left to migrate to another platform, and with Luzmo, you’ll get it done way faster than that!
Evidently, Chartio is a very powerful platform. But we are confident that Luzmo is a great alternative you will love at least as much, and even more because of its powerful embedding. If you’re looking to achieve client-facing reporting, you will simply love the transition to Luzmo!
In this migration guide, you’ll get step-by-step guidance on how to migrate from Chartio to Luzmo. We’ll discuss all of Chartio’s key features, and how these translate to the Luzmo platform.
There are lots of data visualization alternatives out there, and selecting the right BI tool can be overwhelming. Luzmo is a generalist platform that can tackle many use cases. However, there are some use cases in which it truly outshines other players in the market.
Generally, Luzmo will be a great solution for you if:
For all the above reasons, Luzmo is generally a good fit for SaaS companies or service providers, looking to offer client-facing reporting inside their own application.
Does that sound like you? Then Luzmo is definitely right for you. If you’d like to test the waters first, we offer a free 10-day trial to explore the platform, no strings attached.
To migrate from Chartio to Luzmo will be a fairly frictionless process for 2 reasons:
Get ready to make a smooth transition with plenty of resources. We’ll cover how to migrate every step of the dashboarding process below: all the way from data connection to embedding a dashboard.
Just like Chartio, Luzmo connects easily with the most common databases and data warehouses, as shown below. If you were using Chartio in combination with a data warehouse partner like Panoply, we also offer this as a native integration to ensure your smooth transition.
For a full overview of all data sources we natively support, check out the data connector overview.

Your data does not necessarily need to sit in a database or data warehouse in order to connect it to Luzmo. If you want to connect data from a cloud application, your own API, or any other data source we don’t natively support, you can use Luzmo’s plugin API to build your own plugin.

A plugin is a data adapter that sits between Luzmo and any data source of your choice. It queries the data source directly, in order to have the data flow through our systems and populate the dashboard. By default, we will never store data that was passed on through a plugin.
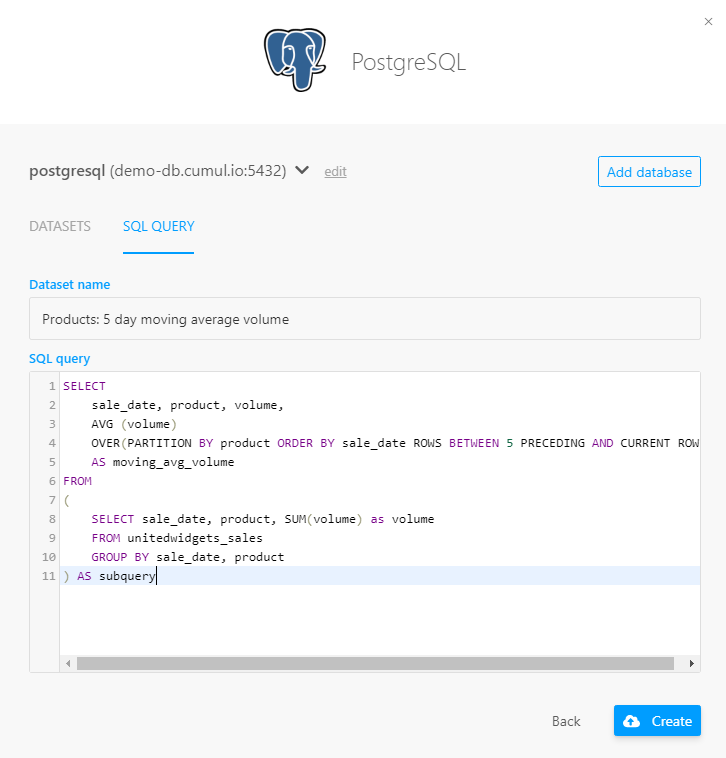
Chartio has a visual SQL editor that lets you produce a chart or a dashboard. In Luzmo, you’ll create charts using a visual drag & drop editor, which automatically generates SQL queries for you.
However, if you prefer having full control over the queries being sent out, there are still a number of ways to do so. You can use our SQL dataset editor to craft a specific SQL query directly inside Luzmo, add (materialized) views as data sources to Luzmo, or make use of Luzmo plugins. For more information, check out the Academy article on writing your own SQL queries.
You will be happy to discover that Luzmo has quite an intuitive interface when you start migrating dashboards from Chartio. This will save you countless hours recreating your most important dashboards.
Let’s highlight a few important similarities & differences of the dashboarding experience in Luzmo vs Chartio.
In Chartio, you’ll typically create charts using a visual or SQL editor, and then save them to a dashboard. It’s important to understand that, in Luzmo, you will create charts on the dashboard level. This means every chart is tied to a single dashboard.
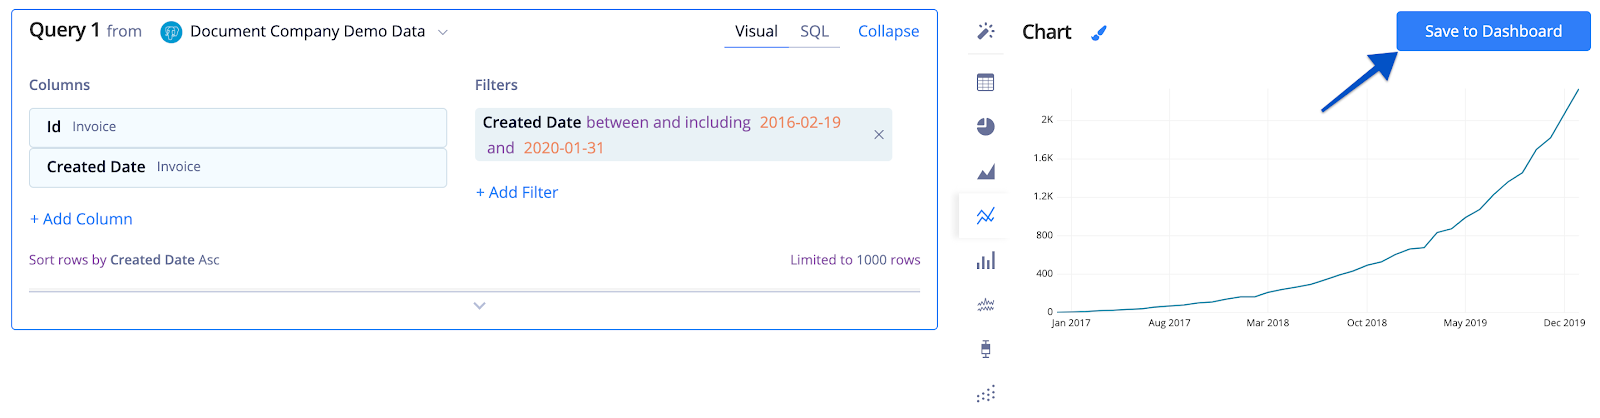
The process of creating a chart in Luzmo feels slightly different compared to Chartio. While Chartio is heavily SQL driven, Luzmo is visually more intuitive and lets you drag & drop charts together on the dashboard canvas. This might be a change at first, but our users love the ease of use!
Once you get used to this new style of editing, the other functions of the platform will feel very similar to Chartio’s features.
Just like Chartio, Luzmo allows you to set different user roles. On account level, a user can either create & manage dashboards, or only view dashboards. You can also set user rights for individual dashboards, and allow someone to only view dashboard A, while giving him or her edit rights on dashboard B, etc.
Later in this guide, we’ll get into more detail on user roles & rights for dashboards that are used in an embedded context.
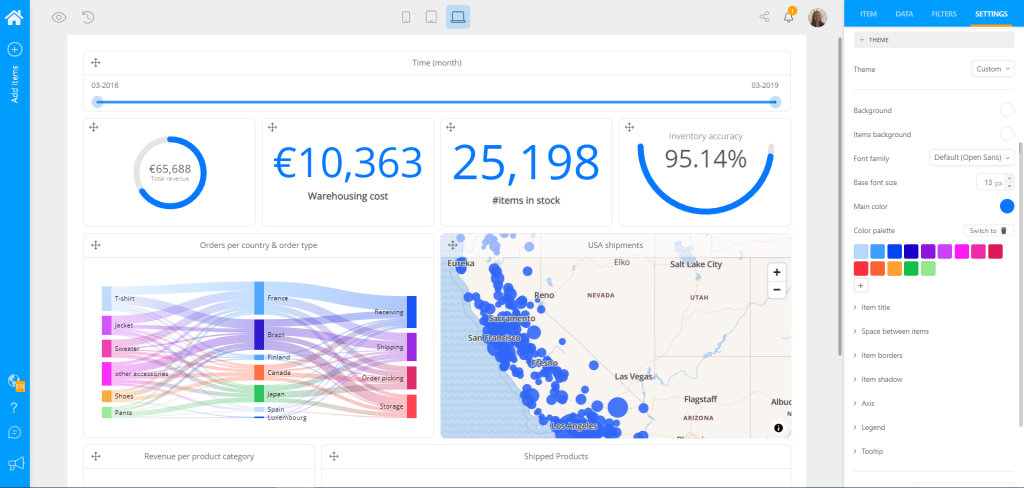
Luzmo’s theme editor is very alike to the Chartio interface. The only difference being Luzmo allows for more customization: adapt borders, padding, shadows, or even add custom CSS. When embedded, you can even go as far as rendering a different styling depending on who views the dashboard.
While Chartio lets you add dashboards to categories, Luzmo uses a tag system that allows you to easily organize dashboards in your account. Whether the dashboard belongs to a specific department, client, or use case.
Luzmo allows similar interactivity as Chartio – including additional interactivity options. When filtering on a chart, the rest of your dashboard will adapt automatically. Drilldown filtering is also available in any chart type. Luzmo also matches all of Chartio’s dashboard controls – only we call them filters. Add a slider, calendar, dropdown or multi-select box to your dashboard with simple drag & drop.
When using the dashboards embedded in your platform, you can add even more interactivity. Trigger an action in your platform directly from the dashboard, such as reordering an item that is almost out of stock.
Luzmo offers roughly the same visualization types as Chartio, including additional chart types like speedometer, sankey, financial charts and more. Each chart type has its own set of customization options, similar to Chartio.
Just like in Chartio, you can set a timezone for your data in Luzmo. You’ll set the timezone on dashboard level, and when someone else views the dashboard, the data will automatically reflect the timezone your user is in.
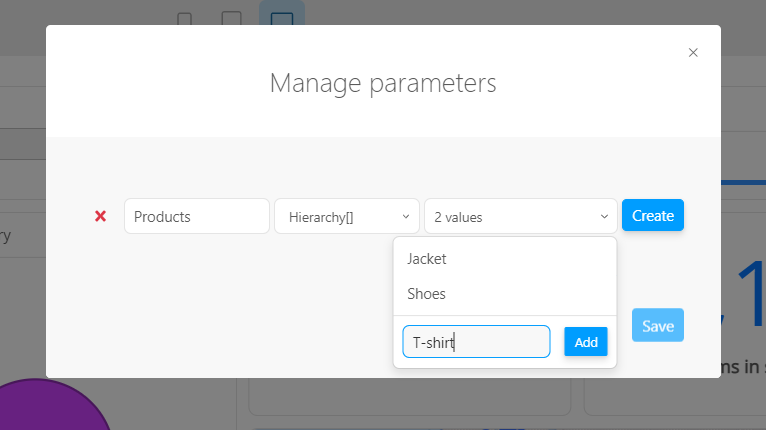
If you want to filter a dashboard based on hidden variables, you can use Luzmo’s parameters. This is especially useful if you want to embed a dashboard, as parameters will be used to define which information will be shown in your dashboard, depending on who is viewing the dashboard.
Just like Chartio, Luzmo has many sharing options available: share your dashboard with a share link, download a PDF or PNG export, schedule automatic email reports, or share dashboards with your clients using interactive embedding.
Embedding a Luzmo dashboard is as simple as copy-pasting the embed code of your dashboard, which can be accessed through the share modal.
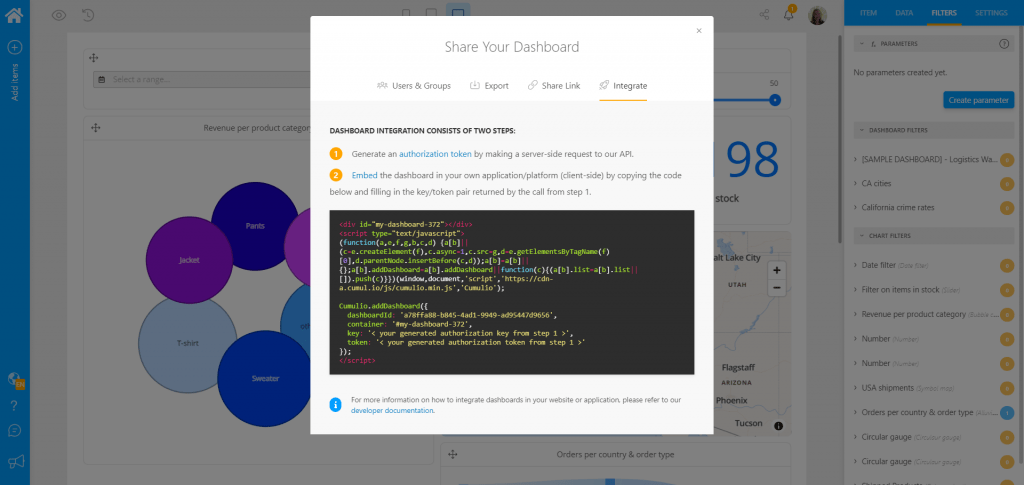
Similar to Chartio’s JWT tokens, Luzmo uses temporary authorization tokens to securely embed dashboards into your platform. In these authorization tokens, you can define which data & dashboards to show to each user, and add other filters to personalize the experience for each viewer of the embedded dashboard.
The advantage is that you can reuse the access rights defined in your platform for each specific user, group or suborganization. If your dashboards are embedded in a login-protected environment, dashboard viewers don’t need an additional Luzmo login. Their platform login will suffice to render the dashboards securely, only showing the data they have access to. This authorization setup is made possible by Luzmo’s Core API, which we’ll discuss in more detail later on.
In addition to the embed script, you can also use our libraries for React, React Native and Angular to embed into your application even more easily.
Our integration API lets you do much more than simply embedding. For example, trigger actions from an embedded dashboard to your platform, create dashboards based on user context, and more! Check out the Integration API documentation or integration course for more information.
If you’re using Chartio’s Admin API to programmatically add or remove users, edit team permissions, or refresh data sources, you’ll find that Luzmo’s API offers an even wider range of functions to leverage.
Our platform was built API-first, meaning anything you can do in the UI is also possible through API. Amongst other things, Luzmo’s Core API lets you:
Apart from the Core API, Luzmo also has an Integration API and Plugin API available. While the plugin API allows you to build plugin data connectors, the Integration API lets you easily embed dashboards and set up interaction between your platform and the embedded dashboards. Check out the developer documentation to get started with Luzmo’s APIs.
With this guide, you’re all set to say goodbye to Chartio for good, and welcome Luzmo to your data stack. 🙌
You’ll love the beautiful-looking dashboards, the easy user interface and the embedded capabilities it provides!
While you migrate from Chartio to Luzmo, these additional resources and documentation will be useful:
Have more questions about your migration from Chartio? Get in touch, our team of product experts is here to help you!
Experience the power of Luzmo. Talk to our product experts for a guided demo or get your hands dirty with a free 10-day trial.


