Experience the power of Luzmo. Talk to our product experts for a guided demo or get your hands dirty with a free 10-day trial.

March 6, 2024
Mieke Houbrechts

When clients heavily request a feature that is not core to your SaaS business, how do you go about creating it? Timewax, a SaaS company in the Project & Resource Management vertical, was confronted with this exact challenge.
Their users’ top feature request? Dashboards and reporting.
In this article, CEO Mark de Jong explains how they tackled this challenge:
The content in this article was presented during the Data Talks 2020 conference. Rewatch the full talk on YouTube.
Timewax’s mission is to help project-based companies get a handle on time and resources. Their clients are agencies, ICT and engineering companies that work on many complex projects for different customers at the same time. It requires intensive resource planning.
Instead of having to manage projects in spreadsheets, Timewax offers a project and resource management SaaS to manage all projects and resources in a single place. Their easy user interface helps their clients to plan their resources more efficiently. In turn, it saves them time, improves project delivery, and increases productivity.
The activity taking place in Timewax generated a ton of raw data that had the potential to be transformed into insight.
With this information, businesses could make much better planning decisions. However, to get these insights, clients were downloading data from Timewax and analyzing it in Excel. For too many, this is normal behavior in SaaS reporting today.
However, Mark was obsessed with user experience and realized this pushes “analyst” work onto the customer. He saw this as a missed opportunity to create delight with customers and further engagement inside the Timewax product. Eventually, enough customers started requesting analytics inside Timewax and it was time to make a change.
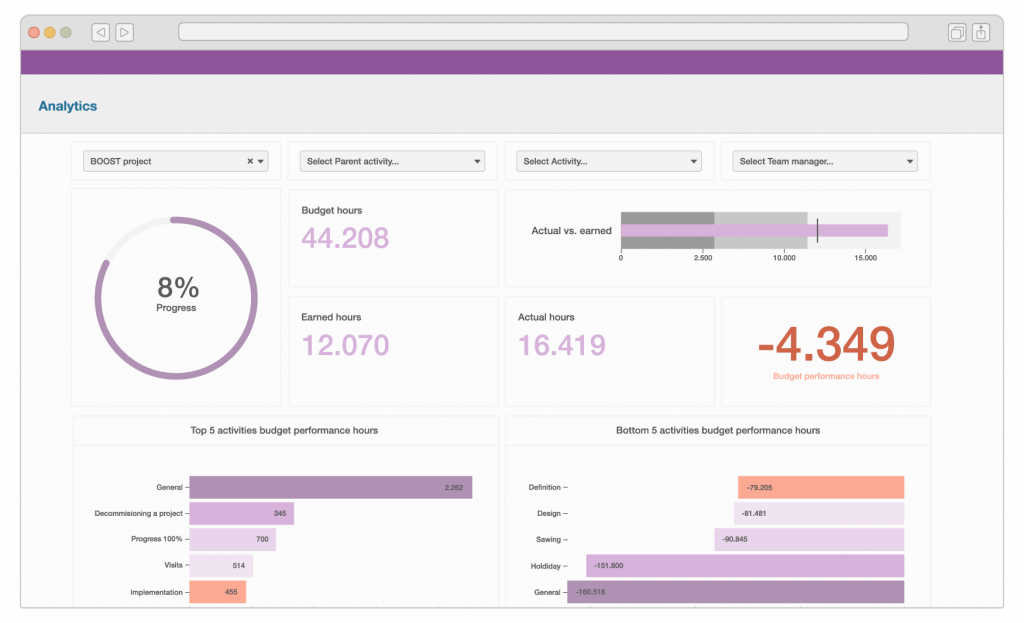
“We needed something much sexier than Excel charts. At that moment, we decided to look for a visual and interactive dashboard solution, which we could integrate into our user interface.”
Mark de Jong, CEO at Timewax
Mark tried other solutions. He was already using Google Data Studio as a dashboarding tool internally. While it worked for internal dashboards, he quickly found limitations in the ability to embed it in the Timewax application. It wasn’t the right fit for the use case he sought.
Mark had 3 main requirements, or “knock-out criteria”.
Timewax needed dashboards that would seamlessly deploy into the front-end of their application.
Given the variety of people and roles involved in complex projects, it was crucial for Mark to have an easy way to set up role-based access rights for analytics features.
For example, a Project Manager will have access to other features and actions in the Timewax platform than a regular employee. Similarly, 2 Project Managers may work in different departments. They have the same access rights, but they can only see the data of their own department.
With Google Data Studio, to achieve the level of access customization they desired, the Timewax team had to recreate redundant dashboards and datasets.
To resolve this, Mark needed a solution that could provide row-level security and access control.

Another frustration with Google Data studio was creating extra users on top of the extra datasets and dashboards. Creating an extra user access point in Google Data Studio is yet another place for customers to log in.
“It would have been a total no-go to ask our clients: Ok, now that you’ve set your user rights in our system, you’ll have to set them up separately in this BI tool as well.”
Mark de Jong, CEO at Timewax
Mark absolutely wanted to re-use the access rights already set up in Timewax. Not only does it make their client’s experience better, it also saves time for Timewax as a SaaS company:
“After building a prototype in Google Data Studio, I realized I needed to build multiple dashboards and multiple datasets for each client separately to make it work. In our 1-to-many delivery model, this simply wasn’t an option. It doesn’t scale. We needed a tool that would let us roll out a single dashboard to all our users and clients.”
Mark De Jong, CEO at Timewax
After trying out different alternatives for embedded analytics, Luzmo met all of their requirements compared to other BI tools.
Most of the other tools that Timewax evaluated need separate servers, which would impact the entire technology stack. Mark chose Luzmo because it plugged into his infrastructure, not the other way around.
“It simply plugs into your existing stack: you paste the embed code into your platform, refer to the business logic inside your own platform. We can even use separate client databases to populate the dashboards.”
Mark De Jong, CEO at Timewax
The Timewax team was able to implement Luzmo in two months, which was considerably less time than they estimated if they had built it on their own. And most of the time invested was dedicated to preparing the data model. They leveraged Luzmo’s in-house data solutions team to get up and running quickly. Our solutions team was primarily focused on preparing an analytics data model primed for quick end-user performance.
Timewax has a tiered pricing model and deployed analytics modules to its ‘professional’ and ‘enterprise’ tiers. This approach gives users a strong incentive to move beyond the entry-level ‘kickstarter’ plan. With the middle tier package, customers get access to a standard set of 30 dashboards, whereas the premium tier provides customers with the ability to customize their own dashboards.
Looking back on the past 3 years with Luzmo, Mark recounts four major benefits.
The first set of benefits impacts how Timewax goes to market.
The second set of benefits impacts how Timewax builds the product.
Mark is also excited about new features like the advanced dimension picker and Embedded Dashboard Editor, which has the potential to give Timewax customers unprecedented access to their data and the ability to slice and dice their data as they see fit.
Interested to build your SaaS analytics module on top of Luzmo? Get a guided tour from our product experts.
Experience the power of Luzmo. Talk to our product experts for a guided demo or get your hands dirty with a free 10-day trial.


