Experience the power of Luzmo. Talk to our product experts for a guided demo or get your hands dirty with a free 10-day trial.


April 11, 2024
Mieke Houbrechts
Looking to implement customer-facing analytics? Discover the top 8 embedded analytics tools to consider in 2024.
It’s hard to imagine our favorite apps without valuable data insights. Think of Strava without its charts showing average speed, heart rate or how many miles you’ve run over a period of time. Or MailChimp without metrics like open rate, bounce rate and unsubscribe rate.
As valuable as these insights may be, building them out for your SaaS app is not something your developers can manage quickly between other tasks. It takes considerable time and effort.
If you want to skip the lengthy development cycles, embedded analytics tools are a tremendous help. In this article, we’ll compare eight of the best embedded analytics tools for 2024, so you can make an informed decision.
An embedded analytics tool is a piece of analytics software that plugs into any web app or SaaS platform. Software builders use it to add analytics capabilities, like interactive dashboards and data visualizations, to their apps, instead of coding something from scratch.
Unlike traditional BI tools, embedded analytics tools make actionable insights available directly inside the apps and software we use daily. Data-driven decision-making becomes part of your users’ daily workflows, without needing a separate business intelligence tool or an experienced data analyst.
If you try a quick Google search for ‘embedded analytics platforms’, you’ll be overwhelmed with choices. Picking the right one for your use case will be much easier if you have a few criteria to evaluate.
The criteria below are a great starting point for embedded analytics requirements, especially for product teams looking to embed in web apps or software platforms.
Choose a tool that is easy to embed in your tech stack of choice - bonus points if it doesn’t lock you into specific cloud providers, databases or programming languages. In addition, you’ll want your analytics to be an integral part of your app, so consider customizable styling options and white-labeling features early on.
Your end-users likely aren’t experts in data science, so ease of use is crucial. Look for functionalities that help with intuitive data exploration, like drag and drop, filtering, drill-downs,... Anything that makes data analysis easy for business users!
If you’re building a cloud-based application, APIs are crucial to connect external tools and new building blocks. If you want your analytics to blend seamlessly with other capabilities of your platform – like authentication or AI layers – pick an API-first platform. It’s much more intuitive for developers to work with, and you’ll have much more flexibility to connect to new data sources.
Since you’re dealing with the sensitive data of your clients, you’ll want to put data security high up on your list of selection criteria for embedded analytics. Look for certifications like SOC-II or GDPR compliance, and check what features they offer to keep your data secure. Things like row-level security, multitenant analytics, data storage options or even virtual private clouds show how much vendors care about data security.
Without further ado, let’s compare some of the top solutions for embedded analytics to consider in 2024.
Best for: embedded business intelligence in SaaS applications, combining user-friendly UI with a powerful open API.
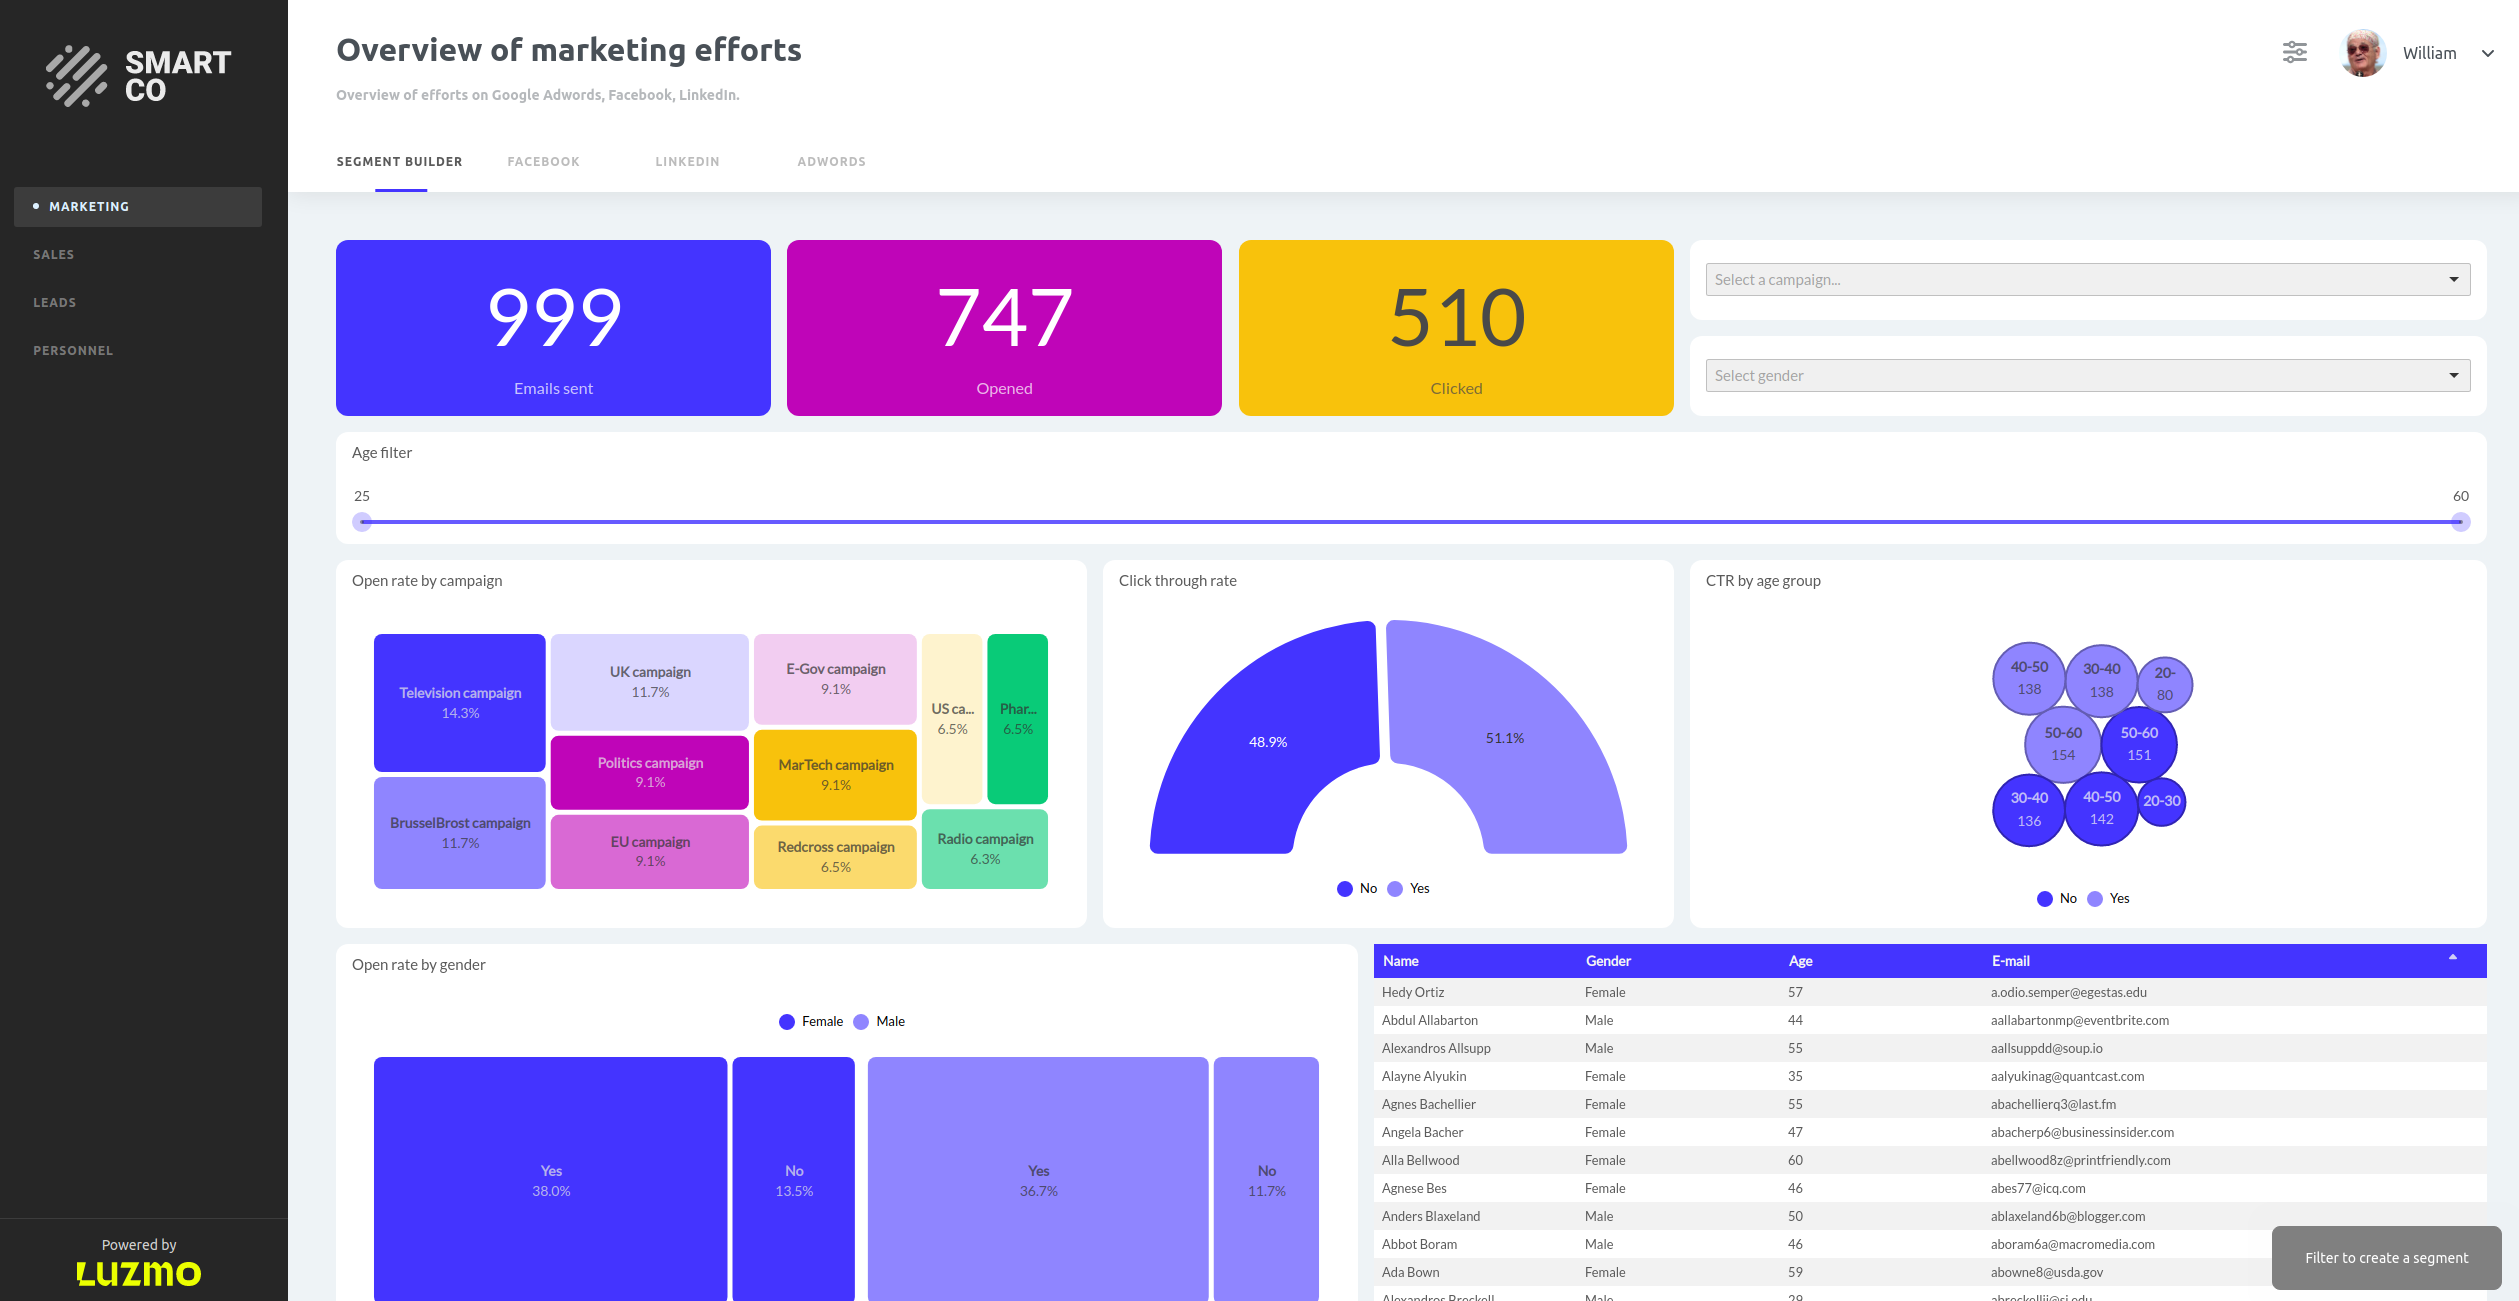
Specifically built for intuitive embedding into SaaS and web apps, Luzmo helps product teams deploy amazing analytics experiences in record time.
Key features
Luzmo is best known for being exceptionally user-friendly. On top of their intuitive drag-and-drop dashboard editor, they offer AI features to ask for insights in plain English, as well as a fully embeddable dashboard editor. Any end-user can dive deep into their data without the need for an experienced data scientist.
Not only the dashboarding is a piece of cake, but so is the implementation. Luzmo can be embedded by simply copy-pasting a few lines of code, or using one of their ready-made libraries for React, Angular or Vue.
But its lightweight nature doesn’t make it less powerful. Luzmo prides itself on having one of the most comprehensive and intuitive APIs on the market. It lets you do anything from connecting proprietary data sources to building integrations with other functionalities of your SaaS app, LLM models, or any other external building block.
Pricing: Luzmo plans start as of $995/month, with a full breakdown of all their pricing tiers on available on their website.
Best for: enterprise companies on the Microsoft ecosystem, or on-premise deployments.
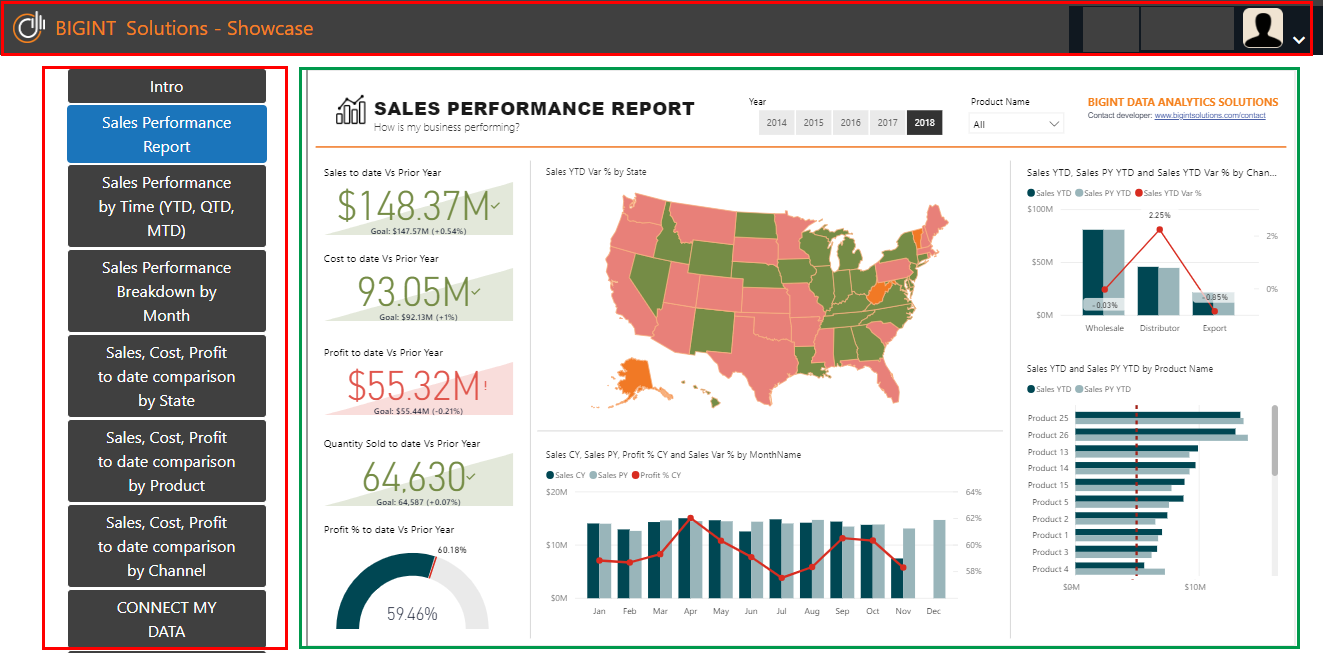
Microsoft Power BI is an established tool in the business intelligence space. Although it’s best known for internal reporting and data visualization, they also offer Power BI embedded, which allows software developers to embed Power BI reports into their online apps or portals.
Key features
If you’re already on the Microsoft stack and have a data analytics team, you’ll love Power BI. Integrating with other Microsoft products like Azure, SQL Server, or Azure Active Directory is a breeze. The downside is that you’ll have a harder time integrating Power BI embedded into a non-Microsoft stack.
If advanced visualizations and complex calculations are important for your use case, Power BI is your top pick. They have a marketplace full of custom visualizations to choose from, and with their DAX formula language, Power BI can go a long way for data manipulation.
Although Microsoft Power BI is best for ad-hoc reporting and internal KPIs, its embedding offering is often a logical choice for Microsoft-minded enterprises.
Pricing: Power BI embedded pricing is difficult to predict since they charge based on the number of virtual cores and memory you need. If you want to get a good estimate, you’ll need to do quite a bit of capacity planning upfront.
Check out the full guide on Power BI for embedded analytics if you want to dive deeper into their capabilities.
Best for: most comprehensive data visualization options.
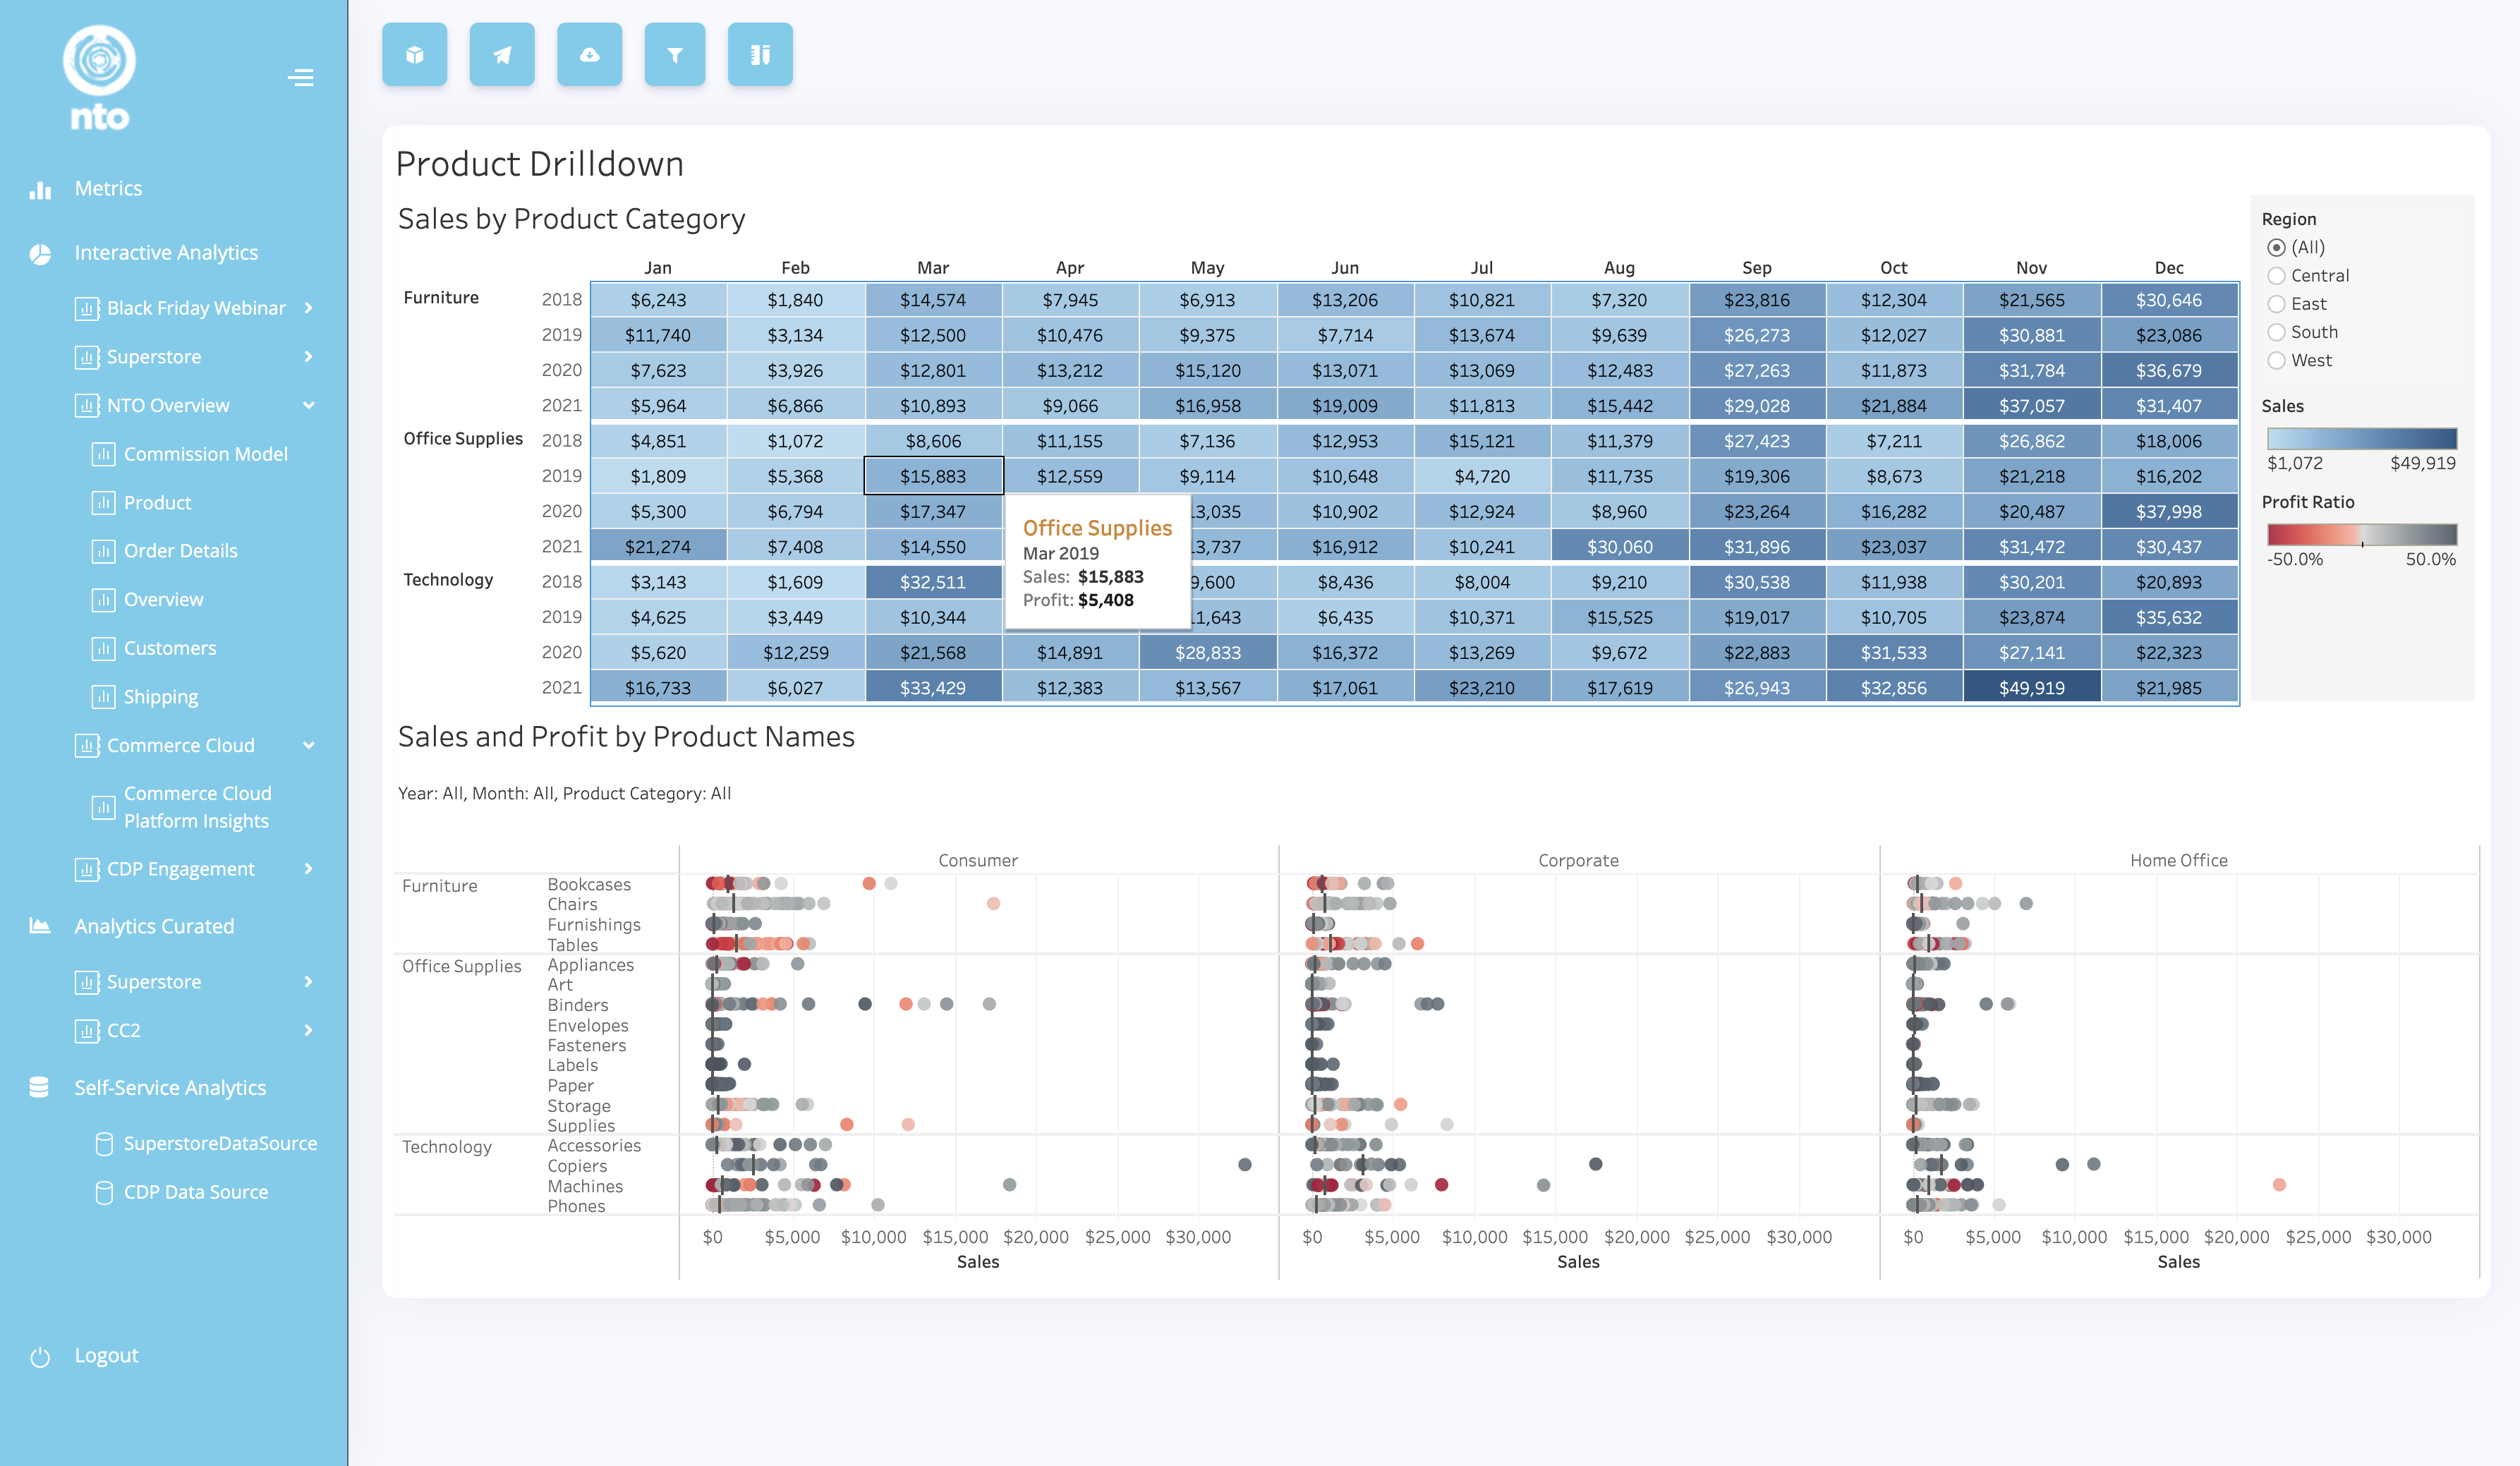
Alongside Power BI, Tableau is one of the pioneers of today’s modern data visualization tools. This self-service BI tool – acquired by Salesforce –- can help anyone, from beginners to experienced data scientists, turn raw data into visual insights without programming. They have an embedded analytics offering that allows you to integrate Tableau visualizations into your software app or website.
Key features
If you want to create impressive embedded dashboards, you’ll love Tableau’s drag-and-drop interface and an immense choice of chart types. If you need advanced analytics, it offers all the bells and whistles, like forecasting, and you’ll have no issues with scalability and handling large datasets.
Tableau also supports a wide range of data connectors. Besides common databases, data warehouses and local files like CSV or Excel, you can use various Tableau integrations to hook up data from your CRM or other web services.
Although embedding isn’t Tableau’s core focus, it’s relatively straightforward to embed in a simple business application. If advanced BI features are more important to your use case than seamless integration, Tableau might work for you.
Pricing: not publicly available for Tableau embedded, you’ll need to contact sales for a quote.
To get the full picture on Tableau, check out our full review of Tableau for data visualization.
Best for: data teams who want data modeling capabilities and real-time analytics.
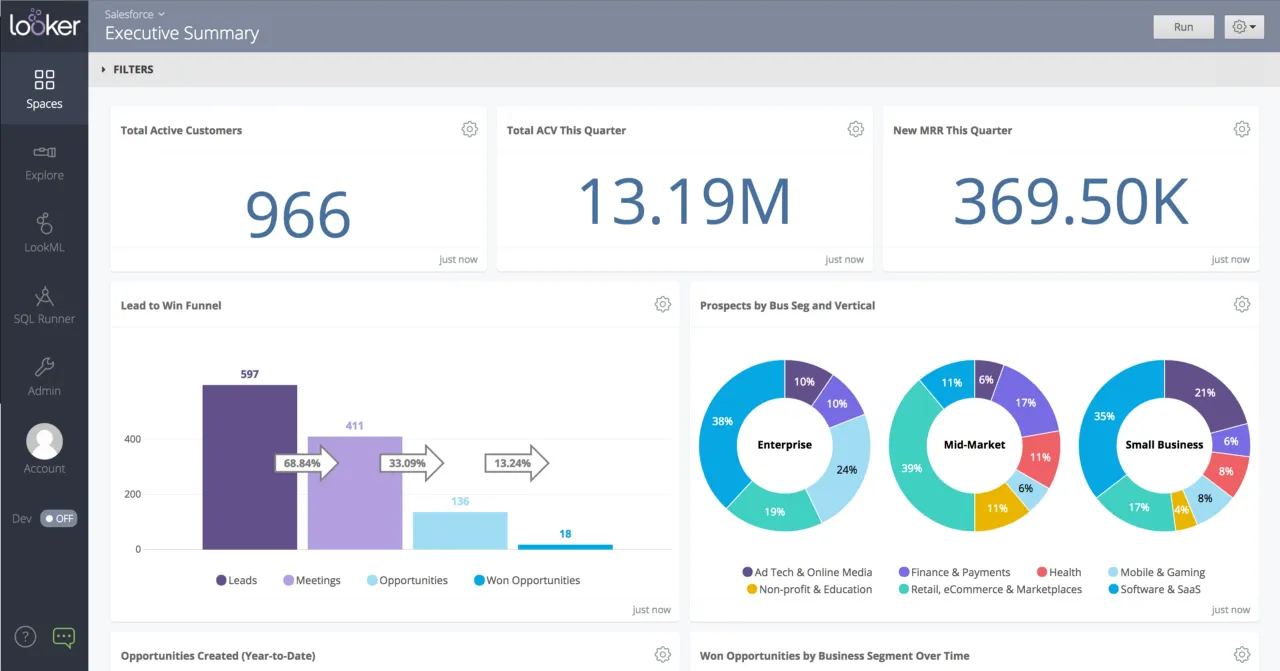
Looker is a cloud-based business intelligence tool, geared towards data scientists and analysts who want to model, explore, analyze and visualize their data. It’s not to be confused with Looker Studio, which is how Google renamed its Data Studio product after acquiring Looker in 2019.
Key features
If you’ve got a team of data scientists who prefer writing queries instead of drag-and-drop, Looker is what you’re looking for. With their proprietary language, LookML, you can do data modeling directly in Looker, and do data discovery using LookML queries.
Less tech-savvy users will have a hard time, but if you need a lot of control over data modeling inside your embedded BI solution, Looker stands out for tech-savvy teams. If you manage to overcome the learning curve of working with LookML, embedding their simple iframes will be pretty straightforward.
Pricing: not disclosed on their website, but users report pricing for Looker embedded analytics reaching up to $5,000/month or more.
For a more comprehensive overview, check out our full review on Looker for embedded analytics.
Best for: AI-powered and search-driven analytics.
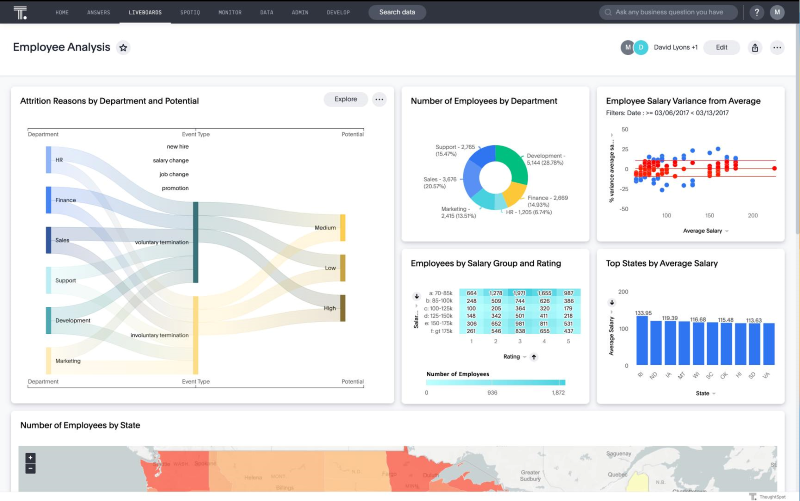
ThoughtSpot takes a slightly different approach to business intelligence with its focus on artificial intelligence for data analysis. Users can analyze their data by asking questions in plain English, making data-driven decision-making more accessible for non-technical folks.
Key features
Unlike dev-oriented tools like Looker, ThoughtSpot eliminates any need for coding or SQL to analyze your data. This makes it much more appealing to business users who simply want to analyze their data.
Add to that their unique value prop of AI-powered analytics, and any user can start exploring data without having a PhD in data science. In theory, that is. In practice, however, users report that ThoughtSpot’s AI-driven analytics are far from perfect. Before exposing embedded analytics to your end-users, you’ll still need a data scientist to prep the data for usage.
Pricing: you’ll need to request a custom quote for embedded analytics, but it’s clear from this ThoughtSpot pricing guide that it’s going to be expensive.
Best for: real-time analytics for businesses who need insights that are up-to-date by seconds.
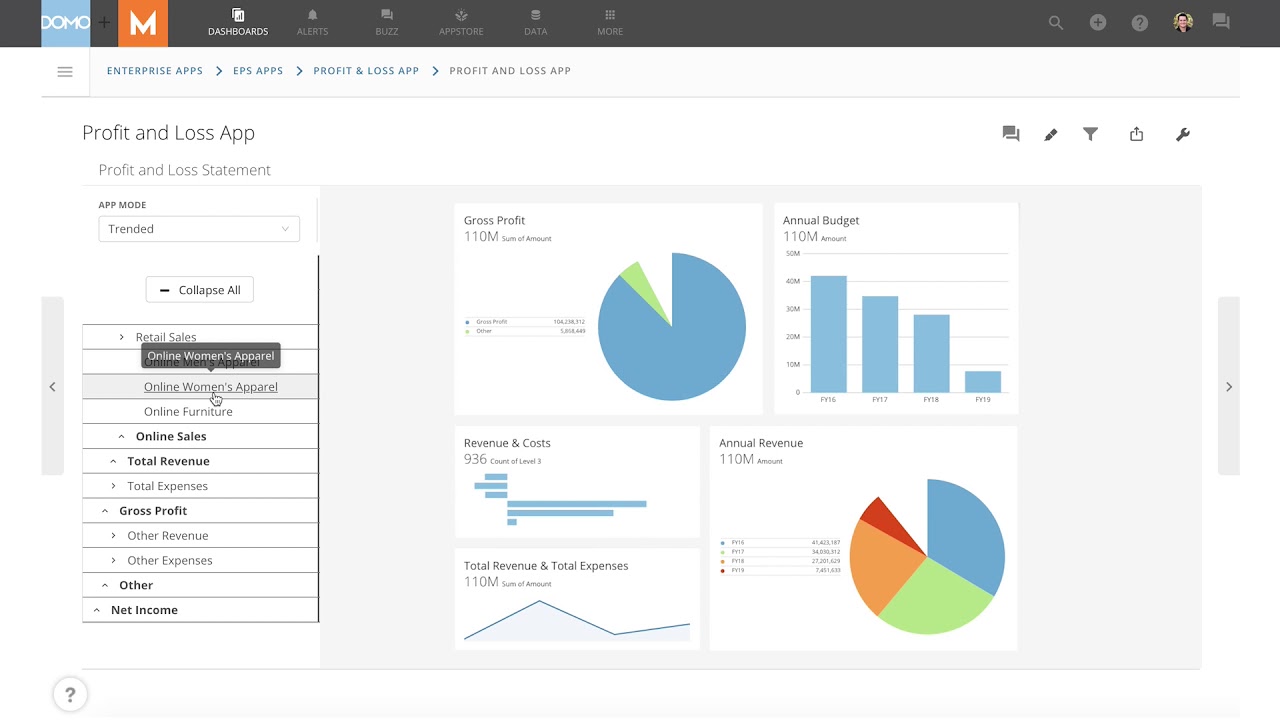
Domo is a cloud-based business intelligence platform that covers many domains: from data visualization to self-service analytics, machine learning, predictive analytics and embedded analytics. With their data experience platform, you can also do data integration and ETL.
Key features
Although Domo is similar to traditional BI tools, it sets itself apart with its focus on real-time insights. With 1,000+ prebuilt connectors, you can hook up almost any data source, and they offer alerts to get insights directly when the data changes.
According to user reviews, the embedding process is relatively straightforward and intuitive. However, if you want a little more support with the setup, Domo might not be it for you. Many users online complain about the lackluster customer support compared to other SaaS tools.
Pricing: their credit-based pricing (by data storage/refresh/ETL needs) is rather mysterious. You’ll need to get in touch with sales for a proper quote, but users say it’s expensive and not transparent.
Best for: complex data integrations and a code-oriented approach to embedding.
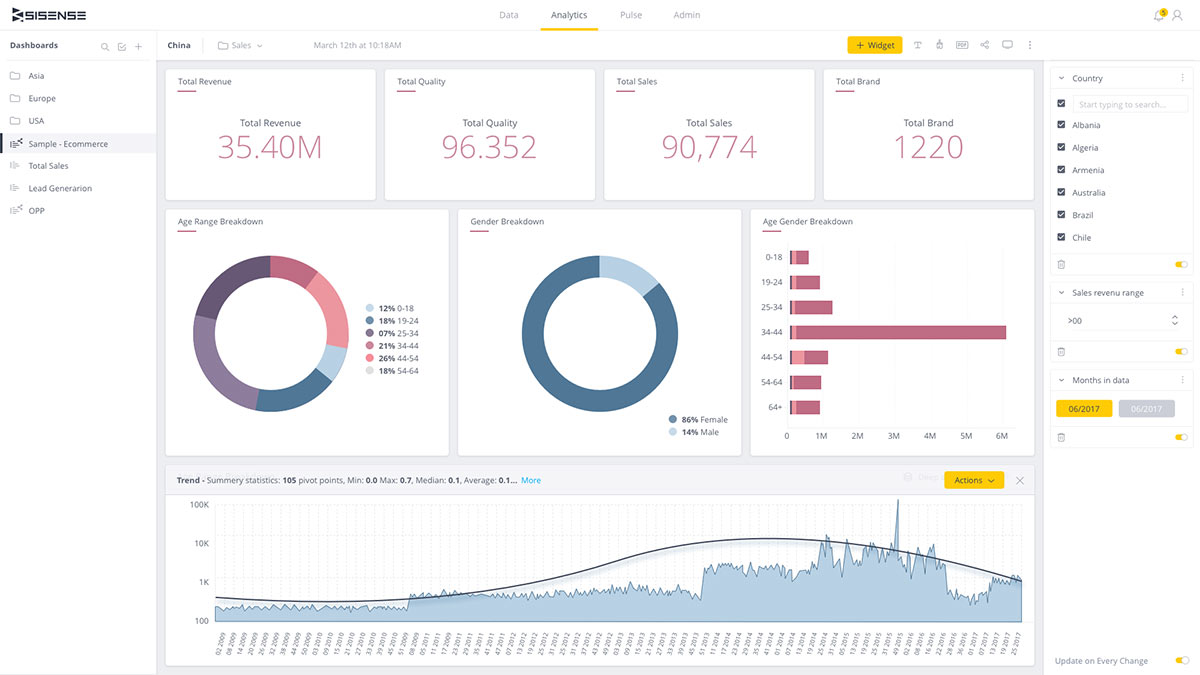
Compared to many other players on this list, Sisense positions itself as an analytics platform focused on embedding. They pride themselves in being highly customizable and scalable, which makes their solution a great fit for enterprise-grade companies.
Key features
Compared to other tools like Luzmo, Sisense takes a code-oriented approach to embedded analytics. They have extensive APIs and SDKs available to build out your analytical features. They recently launched their Compose SDK, which developers will enjoy.
On the flip side, the learning curve can be steep, so prepare to dedicate a good chunk of developer time and resources to your analytics project. If you want a low-maintenance solution that lets non-technical people update and create dashboards, Sisense might not meet your business needs.
Pricing: you need to contact sales for a quote, some online sources state $25k/year as the lowest barrier for entry (and that was 5 years ago - so expect prices to have gone up with inflation).
Best for: automated business monitoring and collaborative data storytelling.
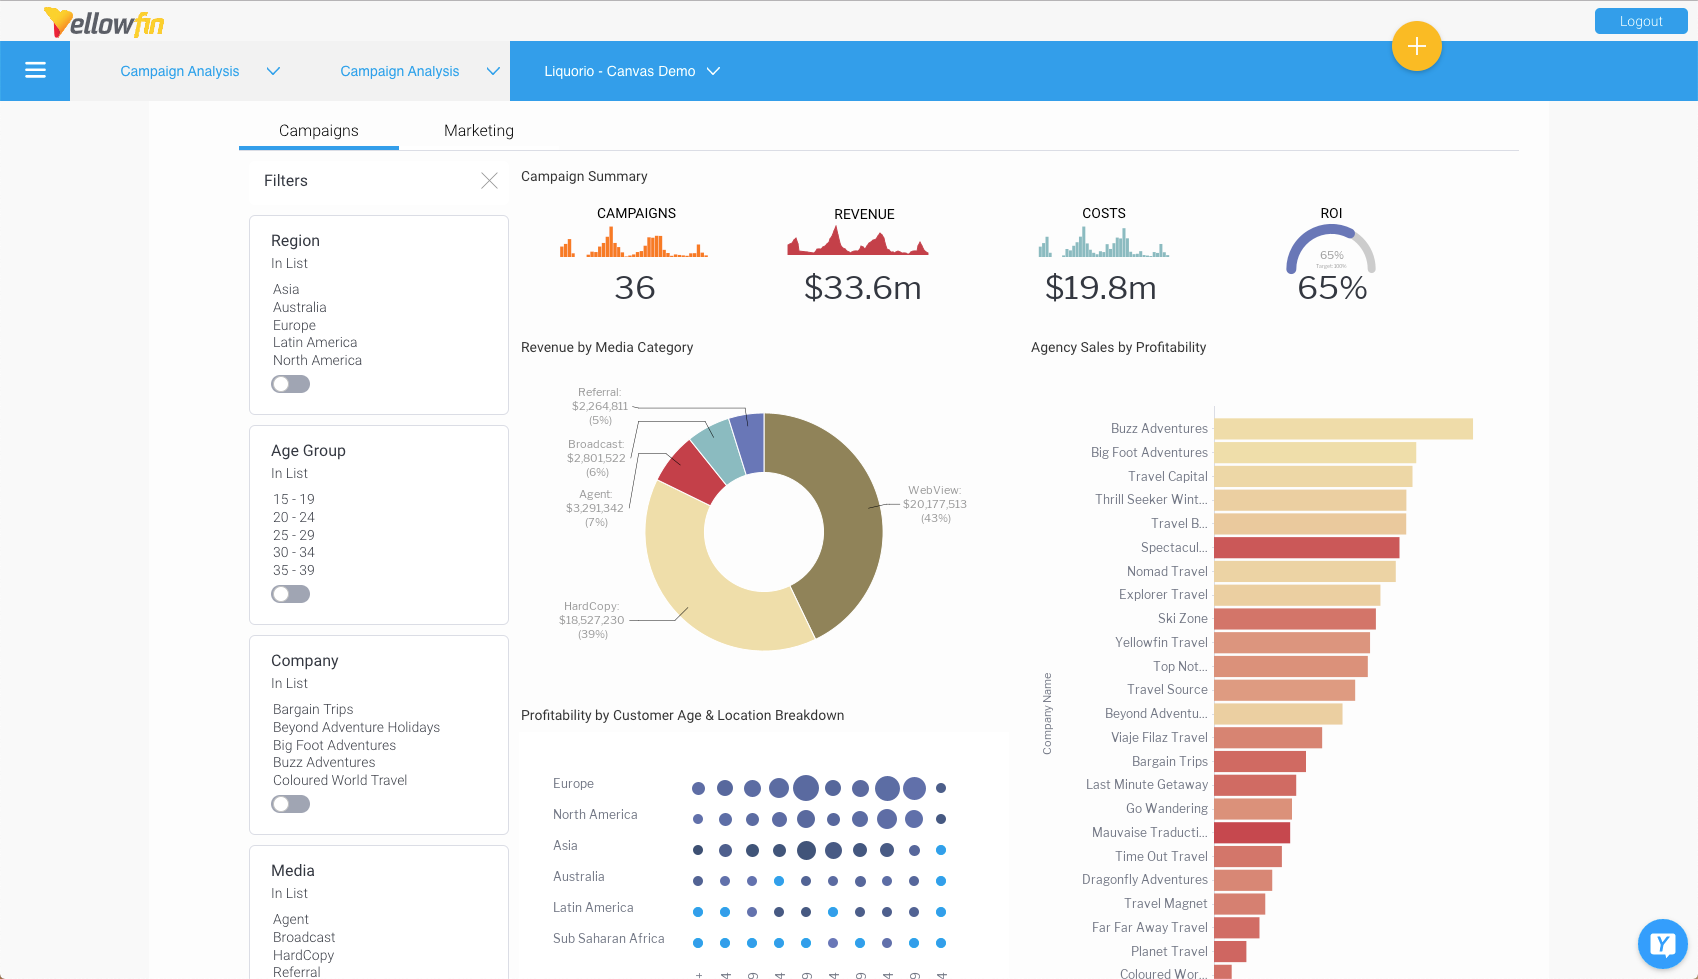
Yellowfin is a business intelligence platform that focuses on action-based analytics and automated business monitoring. Its strong collaboration and data storytelling capabilities make it easy to turn data and graphs into compelling stories.
Key features
Where Yellowfin really shines is in storytelling. They offer storyboards and timelines to make sharing insights easier. With features like real-time alerting and triggering workflows from a dashboard, their tool makes it easy to take action on insights immediately.
If you want something easier to use than bulky tools like Power BI or Tableau, Yellowfin is a great contender. But if you want very advanced data exploration or customization options, there are better options on this list.
Pricing: they offer different pricing models for your specific needs: usage-based, server-based, or even revenue-sharing. None of them are displayed publicly, so you’ll need to reach out to their sales team.
In some ways, choosing the right embedded analytics tool is like buying new glasses. Just like your glasses define your appearance, your analytics will become an integral part of your application. So you’ll want them to look perfect, and fit in well with your app’s look and feel.
At Luzmo, we specialize in embedded analytics for SaaS. If your product users need an intuitive way to explore their data, and you don’t want to compromise on the look and feel, we can help. With Luzmo, you can create the experience your customers want – whether that’s super-advanced analytics or very simple reports – and ship it in days, not months.
Grab your free trial today, and build your first customer-facing dashboard in no time!
Experience the power of Luzmo. Talk to our product experts for a guided demo or get your hands dirty with a free 10-day trial.


