Experience the power of Luzmo. Talk to our product experts for a guided demo or get your hands dirty with a free 10-day trial.


March 25, 2020
Arthur van de Loo
Why are data dashboards for construction projects are so useful? Learn how you can implement construction project dashboards in your own workflows.
Any construction project is an undertaking, and there are a lot of variables at play. Defining relevant KPIs for your construction dashboards is a major help in seeing which aspects of the project are going swimmingly and which ones aren’t.
Which KPIs are relevant differs from project to project, but here are a couple that could help you get a grip on your next construction project.
But why should you even work with a data dashboards for construction projects, you might ask yourself. After all, you’ve been doing fine without one. Well, yes and no – even if you’re really successful you’re probably still leaving opportunities on the table. So, what are those opportunities?
Through visualization in dashboards, you can see the costs of each part of the construction project, which allows you to gauge where you might be overspending.
Some problems are immediately obvious, but some won’t be visible until you take a data-driven approach. These can be trends in failing certain safety inspections, some suppliers being substantially more prone to errors than others, or costs of certain aspects of project development structurally being underestimated, among others. Once you get a clear view of what is happening, you can discover and tackle those issues more quickly and optimize the development process.
This one is significantly more fun than the previous one; once you visualize the data relating to your construction project you can also discover aspects you might excel in without even being aware. You can use this information to change how you position yourself as a project developer or adapt your processes to more optimally take advantage of your strength.
You can use the dashboards of a project to brief a client on your progress and impress them with the oversight it provides you. Additionally, you can also use dashboards of previous projects in the same way – to showcase your previous successes and to prove you’re on top of things with a data-driven approach.
However, which KPIs should you be tracking? This depends on your specific projects and needs of course, but these one should get you started.
Unplanned incidents are a part of construction, although one you’d rather completely avoid them and focus completely on the construction safety for the workers. By visualizing it, though, you can get a clear view of what is going wrong and if there are any trends. This is a definite help in getting the number of incidents as close to zero as possible.
Another useful visualization related to incidents is the time to resolve incidents per supplier. This shows you clearly who is holding up your new development the most.
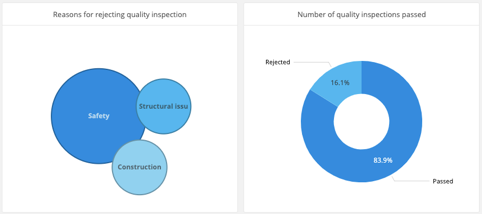
Quality inspections can seriously slow down a project, so getting a handle on what is happening is vital. Of course it’s very useful to know how many quality inspections you have and haven’t passed. A breakdown of the reasons of rejection will make it clear as day what you should be keeping a closer eye on.
Even if it feels evident to mention, budget is a super important metric. Keeping an eye on your budget is something you are most likely doing anyway, but a dashboard gauge makes it a lot clearer.
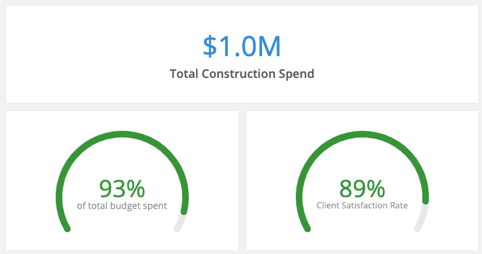
Projected costs turning out to be lower than actual costs can spell trouble for a project. Therefore, it’s very important to keep a close eye on what you’re spending. This is to make sure the projections are not overly optimistic.
Breaking down the projected vs actual costs per construction stage will clearly show you where you overestimated and where you underestimated. This will give you a clearer overview of the costs of the current project. In addition, it will help you make a better estimation of the cost of the next ones.
This can give you a clear overview of how far along your project is. Additionally, you can filter your entire dashboards by status to see (for example) which tasks are blocked.
Need a little more inspiration? Check out our sample app, and look for the real estate and construction-related dashboard examples! Of course, a lot more is possible with dashboards, depending on your needs. Learn more about Luzmo’s different offerings for the construction sector, or book a demo with one of our product experts.
Experience the power of Luzmo. Talk to our product experts for a guided demo or get your hands dirty with a free 10-day trial.


